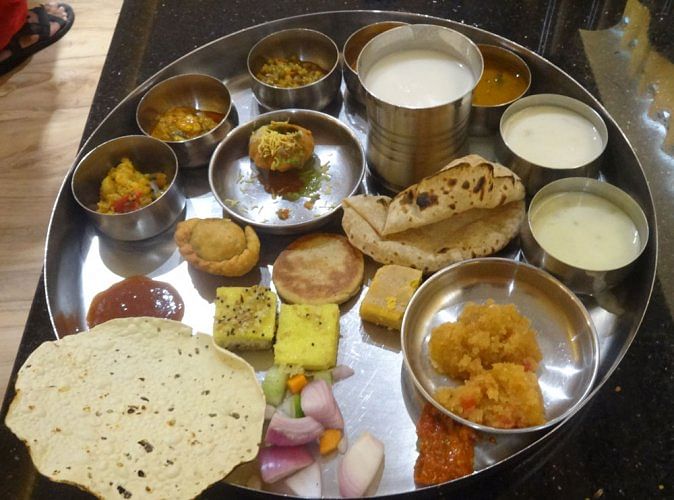
Move over burgernomics, India has got its own version of the consumption index – Thalinomics.
Chief Economic Adviser Krishnamurthy Subramanian has spiced up the Economic Survey using the ubiquitous 'thali' to convey the trends in prices of food and beverages to the common man.
A 27-page chapter on 'Thalinomics: The Economics of a Plate of Food in India' in the Economic Survey seeks to find out whether a 'thali' has become more or less affordable for the common man.
Using the dietary guidelines for Indians prescribed by the National Institute of Nutrition, economists calculated the price of a thali and mapped it with price data from the Consumer Price Index for Industrial Workers for around 80 centres across 25 states and Union Territories from April 2006 to October 2019.
“Both across India and the four regions – North, South, East and West – it is found that the absolute prices of a vegetarian thali have decreased significantly since 2015-16 though the price has increased in 2019,” the Survey said.
In terms of vegetarian thali, the Survey found that an individual who would have spent around 70% of his/her daily wage on two thalis for a household of five in 2006-07 was able to afford the same number of thalis from around 50% of his daily wage in 2019-20 (April to October).
The affordability of non-vegetarian thalis has also increased with the share of wages required decreasing from around 93% to around 79% between 2006-07 and 2019-20 (April to October).
In 2019-20, the most affordable thali was in Jharkhand where two vegetarian thalis for a household of five required about 25% of a worker’s daily wage.
The Big Mac index refers to a survey created by The Economist magazine in 1986 to measure Purchasing Power Parity between nations, using the price of a McDonald's Big Mac as the benchmark.
