By Linda Poon,
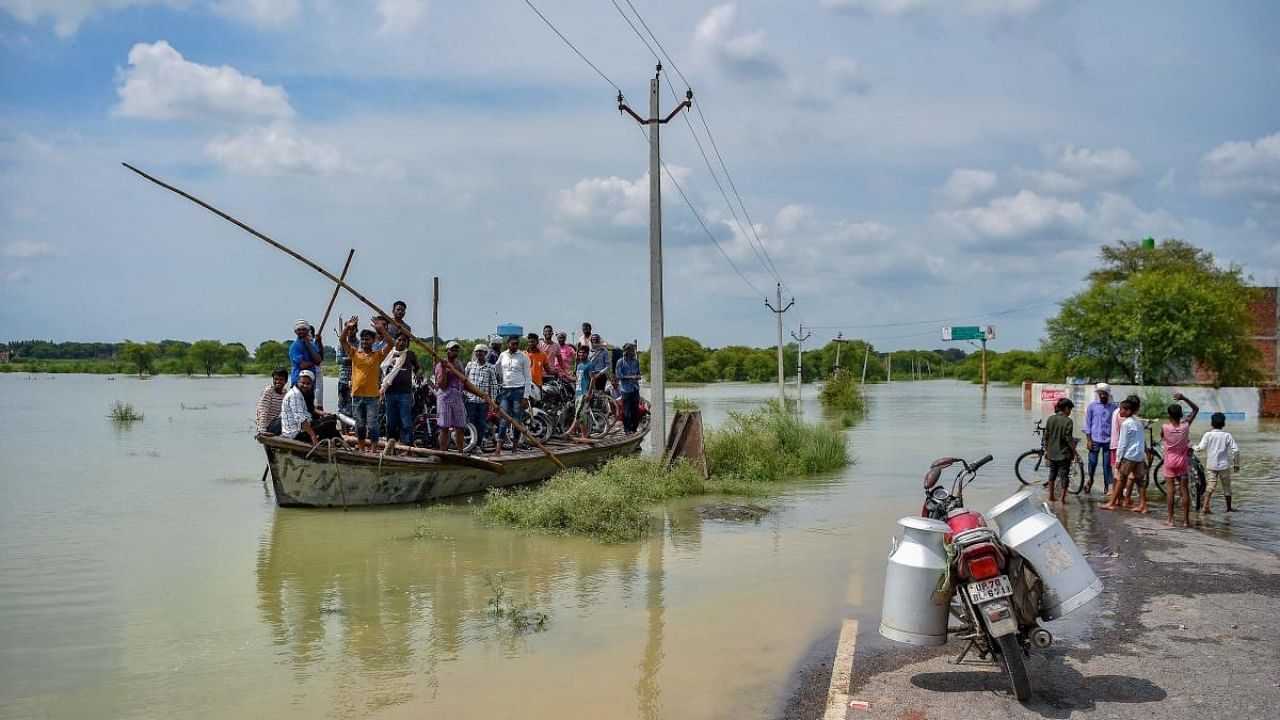
Even as climate change makes flooding more common and more deadly, the proportion of the world’s population living in flood zones has increased exponentially. And it will keep growing if cities continue to develop in risky areas, according to new research published Wednesday in the journal Nature.
From 2000 to 2015, the number of people living in flood-prone areas increased by an estimated 58 million to 86 million, the study found. That marks a 24% increase since 2000 in the proportion of the world population exposed to floods — 10 times higher than what’s been projected by traditional predictive models that rely on terrain elevation data but don’t typically account for urban development and global migration.
The study uses a trove of satellite imagery to map 913 major flood events since 2000, which the flood monitoring startup Cloud to Street says offers planners a more detailed scope than flood projection models of the crisis facing cities. Roughly 861,000 square miles of land were inundated over nearly two decades, affecting 255 million to 290 million people, according to the new flood maps. These maps combine flooding imagery with global human settlement data to show population growth in flooded areas, which the researchers attribute to increased economic development and migration to flood zones.
“While we’re expecting climate change to make things worse, it also shows just how development and demographic change can exacerbate the problem,” says Colin Doyle, co-author of the report and the director of innovation at Cloud to Street, which also turned the flood maps into a massive global database available to the public.
Nearly 90% of the floods analysed occurred in South and Southeast Asia, with high flood exposure in areas that have large river basins and that saw large population growth, like Dhaka and Bangladesh. In 32 countries across four continents, the population exposed to flood is increasing at a rate higher than total population growth, with India and some countries in Africa experiencing particularly large increases in flood exposure. By 2030, according to the study, 25 countries — largely in Europe and North America — will face similar challenges.
The analysis also reveals that the most common floods, making up more than 750 of all the events, were caused by heavy rainfall. That’s in line with past studies that point to urban flooding as a growing threat, and not just because of increasingly extreme weather events. From the recent flooding of New York City’s nearly 120-year-old subway to Zhengzhou’s metro system in China’s Henan province, much of the urban infrastructure built decades ago is not designed to handle the kind of historic rainfall that cities often see today.
Other common flood types include tropical storms, snow and ice melt, and dam breaks — that last of which made up just 13 of the events, but accounted for some of the highest flood-exposed populations. Researchers attributed that in part to the levee effect, in which the sometimes-false sense of security provided by protective infrastructure like sea walls and dams encourages more people to develop or settle in flood-prone areas.
When those protective barriers fail, consequences can be deadly. In August 2008, the embankment designed to contain the Kosi River between Nepal and India partially collapsed, resulting in a devastating flood that left nearly 3 million people homeless in Bihar — one of India’s poorest states.
But that wasn’t an isolated incident. In the years since, the Kosi River has flooded almost annually, forcing thousands to leave their homes in nearby villages to seek safety. As the study points out, often the most vulnerable are those poor populations that are forced to settle in high-risk areas due to economic and political policies.
By making the database public, the group hopes to help policymakers improve the accuracy of global flood risk models, which can be rife with uncertainties. At the local level, Doyle hopes it can improve the quality of vulnerability assessments, which in turn can increase the efficacy of climate adaptation measures.
The searchable database breaks down some of the most historic flooding events in the last two decades. It also maps the impacts of flooding by country, documenting their cause, duration and casualties. In some cases, he says, he hopes the database will become useful in “identifying where we’re developing in high-risk areas, and trying to divert that into less risky places.